Signal of the week: Funding rates turned positive and reached the highest level since January. The last time this happened, it preceded two weeks of rising stress.
This week looks better than the previous one — at least on paper. The liquidations nearly disappeared, and long-term holders crossed back into profitable territory. But the amount of loss being realised per Bitcoin moved hit its highest level since February selloff, and NUPL continued falling. This suggests that the stress gauge is down but the underlying pain is not.
About the Bitcoin Impact Index
The Bitcoin Impact Index measures which groups of Bitcoin holders are under financial stress, how severe that stress is, and whether it’s severe enough to shake confidence in the market’s direction. It combines on-chain holder behaviour, ETF and derivatives activity, and exchange-level liquidity flows into a single weekly score between 0 and 100. Unlike sentiment indicators, it deliberately excludes social media and volume data to focus on what participants are doing rather than what they are saying.
Score bands:
- Normal Rotation (0–24) — routine profit-taking, no structural shift
- Elevated Repositioning (25–49) — specific groups shifting positions, pressure uneven across the market
- High Impact (50–74) — broad stress across multiple holder groups and institutional flows simultaneously
- Critical Impact (75–100) — full capitulation: LTH losses, large ETF outflows, major liquidations, and heavy exchange inflows at once
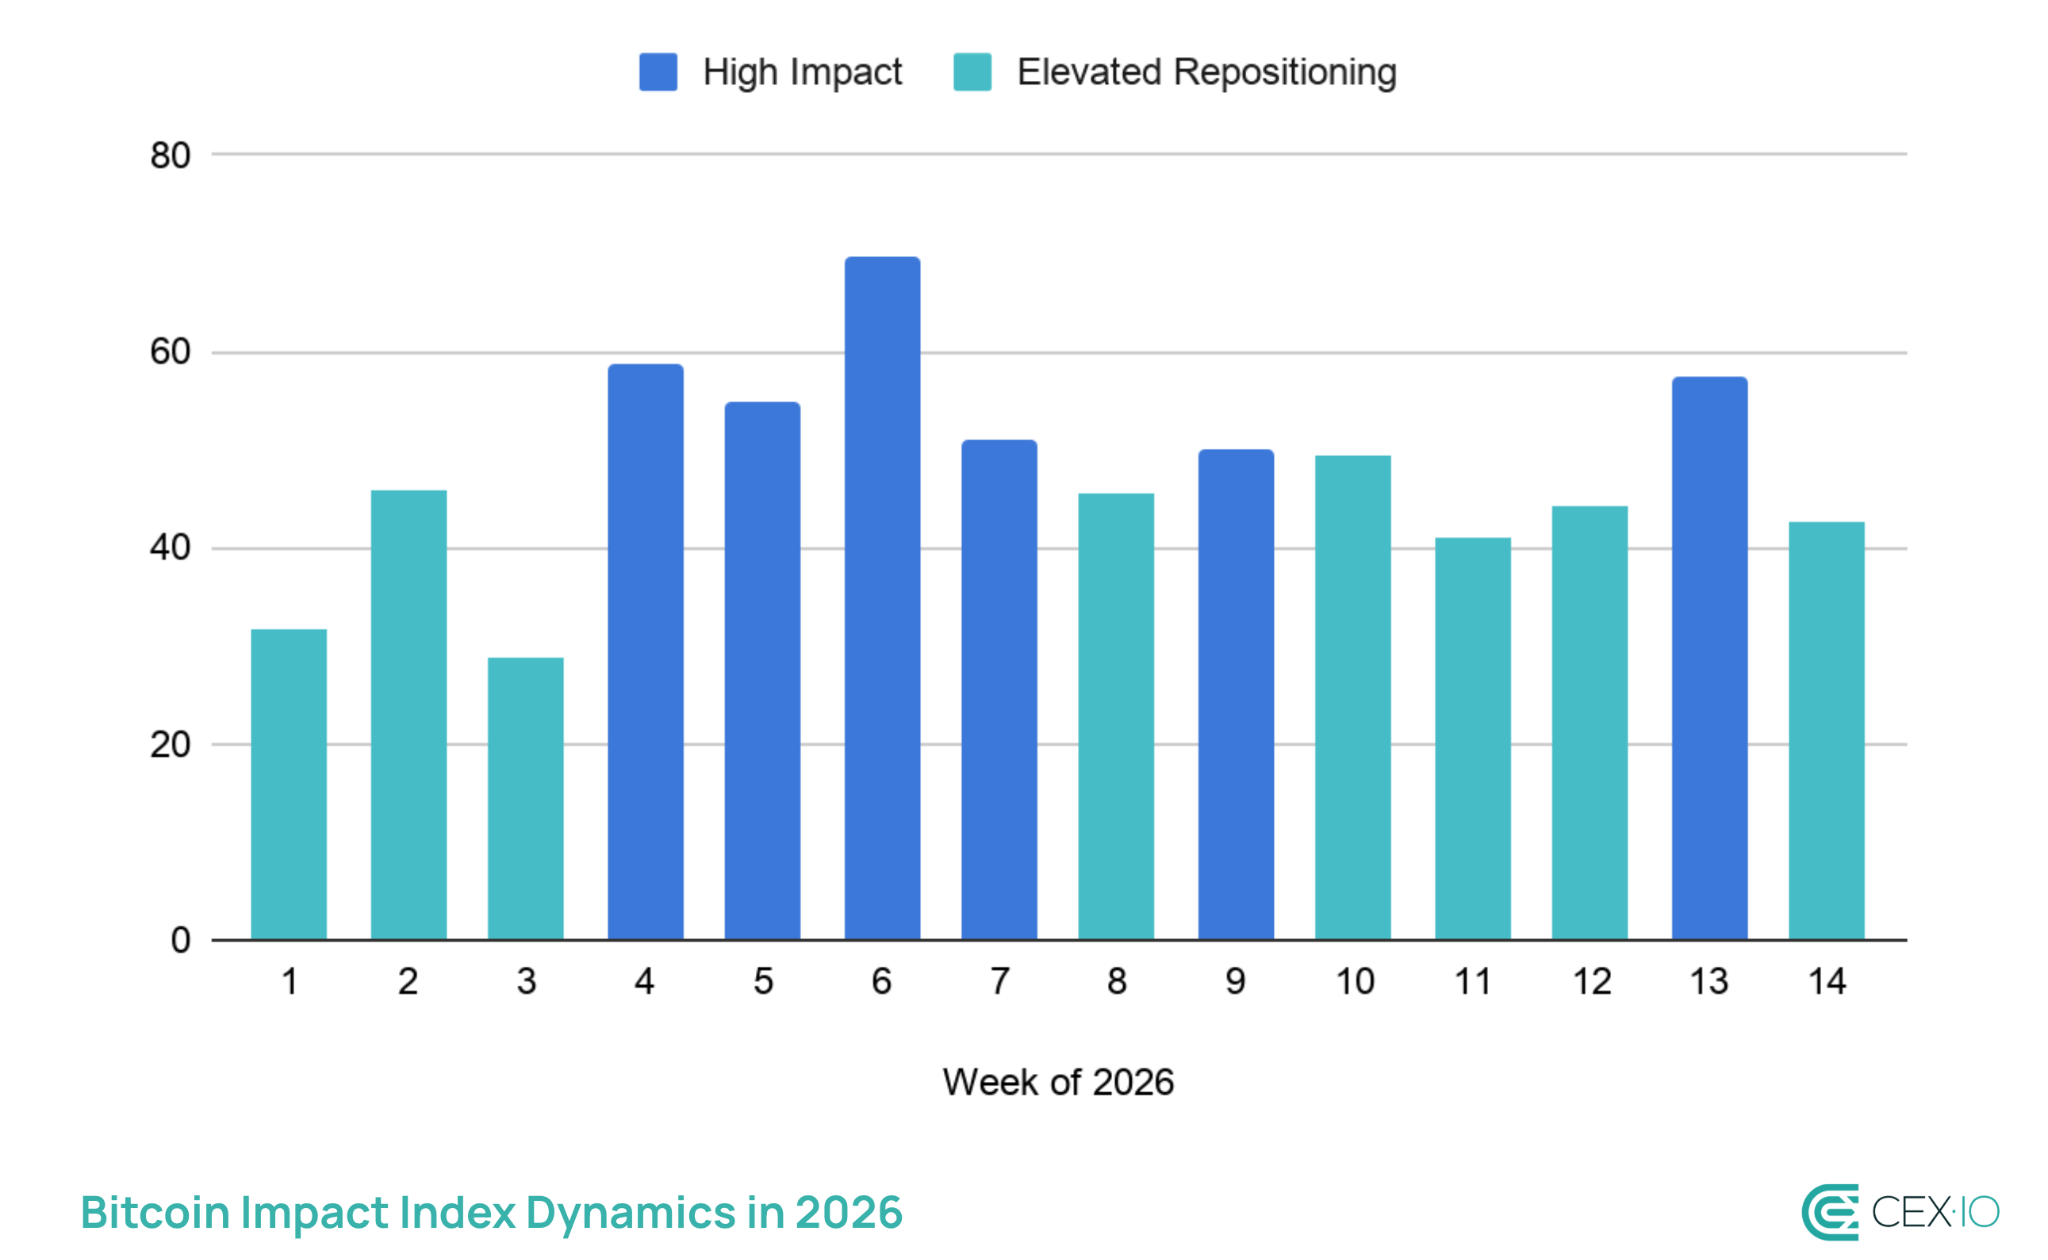
Week 14 (March 29 – April 4): BII 42.5 — Elevated Repositioning
The index dropped 15 points from last week. That is a meaningful improvement — but the data tells a more complicated story.
Positive signals: the worst of previous weeks unwound quickly
The most dramatic shift was in derivatives. Over the past month, leveraged traders were aggressively positioned for further downside. Last week, the pressure released through forced position closures, and total liquidations collapsed to the lowest level since mid-February. With less forced selling pressure in the system, the immediate stress on price eased.
Stablecoin inflows returned positively at $179 million daily average, and Bitcoin arriving at exchanges fell to its lowest level since December, meaning sellers are stepping further back.
Mixed signals: long-term holders are at a crossroads
Long-term holders crossed back to the breakeven line, with LTH SOPR sitting exactly at 1.0. This is a decision point. From here, long-term holders either return to selling at a profit, which would be a genuine structural improvement, or they slip back below breakeven under continued price pressure, which is what happened in previous weeks after a similar brief recovery. This is the third time in 2026 that LTH SOPR approached or crossed 1.0 without sustaining it. Each prior attempt was followed by a deterioration and price decrease.
Funding rates flipping positive is the week’s most ambiguous signal. On the surface it looks like sentiment improving. But the last time funding turned positive, it was followed within two weeks by the sharpest stress escalation of the year.
Negative signals: the pain per Bitcoin moved is near its worst
Despite the improved index value, realized loss density — how much loss is being concentrated per unit of Bitcoin actually moved — hit its highest reading since February’s stress peak. That means the holders who are selling are doing so at deep losses, even as the volume of selling has dropped. Fewer people are selling, but those who are selling are hurting more. That is not the signature of a market that has worked through its stress. It is the signature of holders being squeezed into selling at increasingly bad prices.
Shark and whale wallets both reduced their Bitcoin balances this week, a quiet reversal after weeks of accumulation. NUPL declined for the second consecutive week, meaning the overall profitability of the market continued eroding even as price held relatively stable.
What could happen next
The index improvement this week was driven primarily by derivatives unwinding rather than genuine on-chain healing. The key signals to watch are whether LTH SOPR can stay above 1.0 and build on it rather than slipping back, and whether the realized loss density eases as the holders currently selling at deep losses either exhaust or step back.
If LTH SOPR holds above 1.0 and stablecoin inflows sustain, the index has room to show lower values and the recovery becomes more credible. If the pattern of the past two months repeats — brief improvement followed by a reversal — the index heads back toward High Impact and the mid-2018 and mid-2022 parallels flagged last week become harder to dismiss.
The web content provided by CEX.IO is for educational purposes only. The information and tools provided neither are, nor should be construed as, an offer, or a solicitation of an offer, or a recommendation, to buy, sell or hold any digital asset or to open a particular account or engage in any specific investment strategy. Digital asset markets are highly volatile and can lead to loss of funds.
The availability of the products, features, and services on the CEX.IO platform is subject to jurisdictional limitations. To understand what products and services are available in your region, please see our list of supported countries and territories. This page includes additional links to information about individual products, and their accessibility.
#Bitcoin #Crypto #Trading #Blog #CEX.IO